It wasn't until a conversation tonight on the telephone with Roy that I realised just how much info i'd missed out on setting up of fish stocks and behaviour in FS2. As a result I decided to sit down and write this page, which should be able to help anyone who is creating venues, and should also make an interesting read into the workings and details that are in FS2. Some new bits too will be explained, that have previously not been made common knowledge, hopefully resulting in better stocked venues.
I've lost track of the number of emails people have sent asking "how do you catch fish in fishsim ?", it is probably the most commonly asked question of all, and one in which I don't know the answer to. More concerning than this though, there have been a few emails from people who think that catching a fish in FS2 is down to either luck or waiting a certain period of time. If only it was a simple to program as that, it would have taken just a couple of months to write instead of the 18 months it did. Most of the work that has gone into FS2 is not seen, it goes on in the background. The parts that are visible and can be seen, probably account for only 30% of the whole program, the rest is code that works out the nitty gritty part, like whether or not fish are caught. This is why the title "Fishing Simulator", not, "Fishing game", as a game would concentrate on putting 70% into the look and only 30% into the simulator.
The biggest factor of all though in creating the simulator is not down to the program code, but the data it is supplied with. The old saying garbage in, garbage out ( GIGO ) comes to mind, and it is as true with Fishsim as any other program, in fact with Fishsim, it is more true because it depends solely on the data supplied to be accurate. In one way this is good because it allows a great amount of freedom to customise, improve, and create things as close to real as possible, on the other hand, it means that it is open to being affected by data that is not accurate. Coupled this with the ease and speed of producing addon's for FS2 and things will get out of hand. Hinesight is a useful skill to have, if you have it advance :)
So, in short, the better the data in, the better the simulator, and the worse the data in, the worse the simulator. I think many people agree with my thinking hopefully, and would prefer better quality over more quantity. I haven't mastered creating venues yet in FS2 though, it's something that I think will never be mastered fully either.
Current situation
Where it is at currently is that there is a heck of a lot of venues being released, which is good, but the problem is that the venues are created using the old "copy and paste" technique with the fish stocks. This was clear to see with the gudgeon, where a single corrupt file propergated itself from one venue to over 30. This isn't to say that copying and pasting fish stock files is wrong though, far from it, it is by far the fastest and easiest way to stock a venue. The era of copying and pasting though is now passing and people who use fishsim appear to be looking for something a bit different and more challenging. They are certainly looking for something that resembles the bankside they know and love more accurately.
The other thing that has been very clear is that of "venue popularity", and I have seen in some cases where venues have been deliberately made easy and unrealistic in order that people will fish them. This is definately a mis-guided approach though, and if anyone thinks this is the way to create a popular venue, they couldn't be more wrong. What happens is when a venue like this is created and released there is a sudden surge of fishing that goes on, records smashed all over the place, positive feedback, the lot, making it appear a good venue. This only lasts until the next venue is out though, then the other is put on the back burner never to be fished again, unless a match crops up that is. For one thing, this isn't sustainable, as the only way to sustain it is to create big and better each time, and a venue creator will never manage to keep up with the demand. The sign of a true good venue, is not by the initial reaction, but by the amount of time it is fished in the time two weeks after it is released. Take Silurius for example, it's been out ages, and is probably the hardest venue in FS2, but it is still fished regularly by people a lot now, in search of the catfish record. The recent "bighead carp" hunt, shows that people out there are looking for challenges.
Popularity testing
In the FS Utils, there is a little option called "pop tester", this has not been explained before, but it is one of the simplest and most useful parts in the utilities. In each of the stk files there are lines for defining the behaviour of fish. They are all different, for example tench and carp like the water to be warm, and and other species aren't so bothered. Also, barbel like well oxygenated water, whereas some species like crucian carp don't. PH is another factor, some species like slightly acid water, others like it more alkaline. Then there's feeding depth, some species like rudd, will feed throughout the water, whereas tench feed normally on the bottom. There's lots more factors too, salinity, cover, flow speed, water depth etc..
As an example, consider the following two fish, carp and tench. Both are bottom feeders, this is obvious just from there appearence as they have barbels, yet the carp will also feed off the surface and the tench normally won't. I have seen a tench caught on the top with floating crust in shallow water though, but it is very very rare for this to happen. So how does fishsim account for a complicated set of rules like this ?
If it was programmed in a simple way, like in FS1, then the feeding depth would be set at 100% for both species ( 100 % is bottom, 0 % is top ). This would be fine for the tench, but not strictly true for the carp as they will take off the surface sometimes and also mid water. FS2 is not programmed in such a simple way though, it has an extra few bits of complication added.
The FDEPTH line in the stk files corresponds to the feeding depth, as referred to above and is where all the rules are defined, in four numbers. The first three numbers in the FDEPTH line correspond to percentages, although there ranges can vary outside of the normal 0 - 100 %. Below is an example of how a tench and a carp could be set up, note the differences between the two.
Tench
FDEPTH 100 90 110 1 Carp
FDEPTH 100 -50 110 1
The values can be labelled in order as : Ideal, Minimum, Maximum and Tests.
The first value ideal, in this case represents the ideal feeding depth of the fish, both the carp and the tench is set to 100% - on the bottom. In other words, if you was fishing for carp or tench, you would fish on the bottom, as years of experience has shown you this.
The next value minimum, is the minimum feeding depth for the species. The two species vary, for the tench, it is set to 90%, in other words, all the tench defined with this stk line in, will never be caught above 90% of the depth, they will always stay within the bottom 10% of the water. With the carp though this is set to -50, which may seem strange as a percentage, but there is a good reason for it. If you think about it, what this means is that if 0% is the surface, -50% must be somewhere hovering above the lake ! It doesn't matter though and there is a good reason for doing it this way, as will be seen in a minute with the pop-tester.
The maximum value is set at 110 % for both species, and doesn't have any affect on either species in this example as it is impossible in FS2 to fish deeper than the bottom which is 100%.
The final value, tests, is a measure of how important the feeding depth behaviour is for the species. It is a whole number, and the higher the number, the more important it is. Both values are set to 1 though in this example, which means that it isn't really important, but this is only sample data, and there will be more on this later.
This is where the pop tester in FS Utils comes in though and is a really handy tool for testing these values out.
To test out the tench values, start FS Utils and the pop tester. In the boxes that appear across the top, add the four lines for the tench above for ideal, min, max and tests. These are the values that are going to be tested. In the factor box, type in 95.0. The factor box corresponds to the depth you are simulating fishing at. In other words, you are saying, i'm fishing at 95% depth, tell me what my chances of catching a fish with the above values are ?
Then click the start button, and the Working box will start to flash, as well as the Pass and Fail boxes changing values. After a short while the numbers in the pass and fail boxes should start to settle a little bit, probably around the 50 % / 50 % mark. What this is saying is that when anyone fishes at 95% depth for a fish with these values, they stand a 50 / 50 chance of getting a bite from the fish, not ideal, but not bad at all either.
Now click the Stop button to stop the pop-tester simulating and also click the Reset button once. Now change the factor to 0.0, in other words, simulating fishing on the surface ( 0% ). Now click the Start button again, and what you should see is that no matter how long you keep it running for, you will always get a 100 % fail rate. In other words, you're never going to catch a tench on the surface. This may not be entirely true though, as in very shallow water in FS2, you may still stand a small chance, even though the pop tester is saying otherwise.
Now change the values to the carp values above, and do the same two tests, with the, first test simulating fishing at 95 % depth and the second test fishing on the surface at 0 %. Remember to use the Stop / Start and Reset buttons after each though.
What you should find is that at 95 % depth, you get a pass rate of around 95% for carp, and on the surface ( 0 % ) you get a pass rate of around 30 %.
This is simulating pretty closely to the rule defined above, where tench feed on the bottom and nowhere else, and carp feed on the bottom normally, but will also feed off the surface occasionally. Don't worry about things like water temperature etc just yet with carp feeding, that bit comes in a minute.
Try other factors as well simulating different depths, and also changing the ideal, min, max lines to see the difference that is made, when each are changed.
How it works
So far that has proved that it is possible to simulate complicated rules, but what hasn't been explained is why the changes to the min value for the two species resulted in a change of behaviour in feeding depth.
If a value is entered for the factor which is the same as the ideal value for the species ( 100 in the two cases above ), the pass rate will always be 100 %, nothing will ever fail. This is because the angler will be fishing at the ideal depth for the species and the species will be feeding at that depth. However, when fishing at any other depth, it may be still possible that the species is feeding there, but less likely, but the closer to the ideal, the better chance there is.
Taking the tench case above fishing at 95 %. How fishsim 2 works, is that because 95 % is less than the ideal ( 100 % ), it will use the min value as well to calculate to see if a fish is feeding at the depth. It will pick a random number between the min value ( 90 ) and the ideal value ( 100 ). Say for example it selects 98 as the random number. As 98 is greater than the fishing depth, it will fail the test. If it had chosen 92 as the random number, the test would have been passed.
So if a random number between min and ideal is less than the fishing depth the test is passed, otherwise it fails.
Lets say then, that the angler increases the depth (s)he is fishing, and fishes, not at 95%, but 98%. This means a random number between 90 and 100 would be chosen, and if the number is 90,91,92,93,94,95,96,97 or 98 the test would be passed, or if the number was 99 or 100 the test would fail. If you think about it, (s)he now has a better chance, before, fishing at 95% depth, the passed random number selections would have been 90,91,92,93,94 and 95, and the failed ones would have been 96,97,98,99 or 100 - there were less pass possibilities and more fail ones than before fishing at 98%.
You may need to re-read that one again, sorry, best explanation I could come up with, but if you understand it, then you should be able to see why there is a better chance of catching a carp at 95% depth than there is a tench, because the min value for the carp was set at -50, which means that a random number between -50 and 100 would have been chosen, and there would have been a lot of choices less than 95% ( -50 -> 95 ) than there would have been failed choices ( 96 -> 100 ).
The same case applies to when the angler is fishing at a depth greater than the ideal depth, apart from this time, a random number between the ideal depth and the max depth is chosen.
What about tests
The test value is used to specify how important a factor is in determining the behaviour of the fish. In the above examples. For a fish to even consider taking the bait, it has to pass all the tests specified, one failure and it will ignore the bait. There has only been one test so far specified though for the fishing depth for both the carp and tench, which effectively makes it less important a factor. For the real fishing stocks, all the factors should ideally have a minimum of 2 tests each, and only in rare cases have a single or no tests. To show the effect of upping the value of the tests, use the pop-tester again with the carp values above fishing on the surface ( 0.0 % ) but instead of setting the tests value to 1, set it at 3 and start it simulating. You will notice now, that instead of before, where we were looking at a 30 % ish pass rate surface fishing for carp, now we're looking at only a 3 - 4 % pass rate, just by adding an extra couple of tests. However a factor closer to the ideal will result in a better pass rate still.
This means that by increasing the number of tests, it will require more skill by the angler in finding the fish, as (s)he will have to get it closer to the ideal. This is one way, which venues have been created where the stocks have been made artificially easy to catch, with test values of 1 for all the factors. When stocks are created like this, there is no point at all going to the trouble of starting FS2, you may as well sit there tossing a coin instead.
Another way, of making fish easier to catch is by stretching out the min and max values to be further from the ideal. Just like in the carp example above, by setting the min to - 50, made it easier to catch than the tench at 95% depth.
By combining these two, single or no tests, and stretched boundaries, fishsim becomes simply a game of pure luck, an effect which I think is now being realised by a lot of people.
What should be happening, is for venue creators to try and make the tests as high as possible, and the min / max boundaries as close as possible to the ideal. A venue created with stocks like these, that still fishes well, is truely a superb and rewarding venue to fish.
Other factors
There are other factors too, but the principle is exactly the same. With the fishing depth though, the angler has direct control over this by adjusting the depth of the float or the rig. Most of the other factors are environmental factors like water temperature, oxygen content, PH etc. where the angler has no control, and it is purely down to the venue itself and area casted. Of these, water temperature is one of the most important, and when creating venues, it is handy to know what the temperature of the water is. This isn't easy though, because it depends on a lot of factors, time of year and day being the most important, followed by water depth, fishing depth, water turbidity ( murkiness ), and even objects that are placed in the water ( weed, mud, rock etc.. ).
The digi-therm is a handy tool for seeing the temperature of the water at the casted area, but if you think about it, there are a lot of areas to cast, and a lot of depths to test in those areas too, on top of this there are diffrerent dates and times to test. The water temperature is updated every minute in FS2 and is unique to the exact minute and date, so the digi-therm, whilst being handy, is still not ideally suited to the job.
There is another way though as well, not as accurate as the digi-therm, but accurate enough to be used. You can view water temperature graphs in FS2 ( only implemented in version 2.06 and higher ). The code for doing this was the first ever part of FS2 to be programmed in, it's just that it hasn't been accessible before version 2.06 from the program, even though the code was there.
To set it up, you will need to locate and edit the app.ini file in the INF folder of FS2. At the bottom of the file add the following lines and save the file.
[Temps]
On = 1
P0 = 0
P1 = 30
P2 = 31
P3 = 32
P4 = 33
P5 = 500
P6 = 501
P7 = 502
P8 = 503
P9 = 504
You can monitor and graph the temperature at 10 different depths for each day of every month. With the values above, the temperature at the depths 0 cm ( surface ), 30 cm, 31 cm, 32 cm, 33 cm, 500 cm, 501 cm, 502 cm, 503 cm and 504 cm will be graphed. I group them like this because it graphs two distinct dark lines which are easy to follow. You can have whatever values you like though, from 0 cm to 900 cm ( 9 metres ), the only limitation is though, that you must specify 10 and no two can be set to the same depth. You can also change these values in the file without needing to restart FS2 as well. If you minimise FS2 on the venue/peg selection screen using ALT-TAB ( note may not work on all operating systems such as XP or win 2K ), then edit the app.ini file to put new depths in and save it.
To view the temperature graph in FS2, click on the small peg image prior to going fishing, to access the screen where the depth flag type thing that moves with the mouse is found. Then press the F6 key on the keyboard, you will see something similar to below :
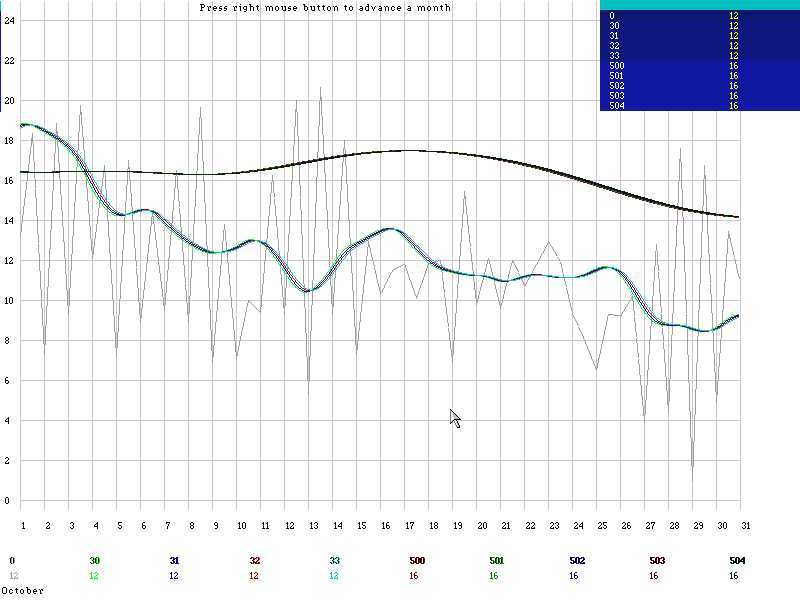
It may look a bit complicated, but it isn't really. In the bottom left of the screen it shows the month you are viewing, in the case above i'm on October. It will always start at January, and to advance a month, click the right mouse button. On the graph, the X axis ( across ), shows the day of the month, always 1-31, even though some months have less days. On the Y axis ( up ), it shows the temperature range, always starting at 0 degrees C and going up to 24 degrees. As a reminder to you, the depths specified in the app.ini file are shown along the bottom in different colours. Each coloured line on the graph corresponds to the temperature at that depth at that day and time of the month. So on the graph above, the water temperature at 33 cm down, at aprox midday on the 13th October, would be roughly 11 degrees celcius. 33 cm is represented by a light blue line.
Just at a glance at the graph, you can see what happens to the water temperature on the river lot in october. The higher water ( near surface ) temperature starts quite high, around 19 degrees and drops off rapidly to around 9 degrees by the end of the month. The deep water, the dark line ( 500 cm - 5 metres ), changes less erratically, and although it drops slightly, stays pretty constant between 14 and 17 degrees throughout the month. You can see the surface temperature also, at 0 cm, represented by the light grey line. This changes very erratically throughout each day as the external weather and temperature will have more of an immediate effect on it.
Also the blue box in the top right, gives a summary of the average temperatures at the different depths for the month, as can be seen, on the river lot, which is where the temperature is being mapped from on the graph above, it is actually warmer at 5 metres down than it is nearer the surface in october. Bear in mind that each venue / peg will have it's own unique temperature graph, don't assume they are all the same, because they are definately not. For example, have a look at the river dane. The temperatures are a lot more erratic on this venue compared with the river lot, as it is a brisk flowing small river, and the water mixes more, so the external temperature has a lot bigger impact.
As said before these graphs give a rough accurate enough approximation of what the water temperature will be for a peg throughout the year at different depths, but it doesn't take into account objects that are placed at different areas in a peg. An overhanging object for example, will shade the water, resulting in a slightly cooler temperature in them areas. Objects such as mud will also raise the temperature slightly, especially if it is windy or been raining. This has the effect of clouding the water, which results in generally warmer water containing less disolved oxygen. Strong winds are also not accouted for in the graph above, as these too can mix up the water more, and generally cool it more too. The graphs though do give a good idea of what the water temperatures of a peg will be and can be used when creating fish stock files.
With fish stock files the TEMP line acts exactly the same as the FDEPTH line, with the only difference being that instead of the values for ideal, min and max being percentages, they are absolute water temperature values. So if I was creating a peg, where I wanted a certain stock to be quite active in water around 30 cm in October for the river lot, i'd set its ideal temperature to 12 degrees or something around that.
Carp generally like warmer water though, and various sources have said the ideal temperature for carp is around 25 degrees C ! With the way FS2 works, this means that in summer, the carp will probably be better caught around the margins, where they can feed on the bottom in the shallower warmer water, and in winter the only chance of getting them will be at the bottom of the warmer deeper water. This is one of the ways FS2 moves fish about in the pegs, they will always be prepared to feed, but if the conditions are not ideal, they will not feed as readily. You can use the pop tester again though with values in stk files, and use the graphs to take the water temperature value for the factor to test with.
With factors such as O2, light and PH, there isn't any graphing features available though and the digi-therm has to be used as a guide unfortunately.
(c) J.C.Spooner